CS 6670 Project 1 Report
Shuo Chen
・
My
Feature Descriptor
I finally use the simplified SIFT descriptor as described in the slides. The details are
1. Take a 17×17 window around the feature pixel. Rotate it according to the feature’s radian angle, which is the direction of the eigenvector that corresponds the largest eigenvalue of Harris matrix. Then take the 17×17 image patch.
2. Use a 5×5 Gaussian window to filter the patch.
3. Divide the patch to 16 4×4 subpatches (the last row and column are left over).
4. For each of the subpatch, calculate its gradient directions. Form an 8-bin histogram to store the distribution of those directions. Each bin covers a range of π/4.
5. Use all the 16 histogram to describe feature.
This function is named as ComputeMySIFTDescriptors in my code. I also tried some other descriptor. In the function ComputeCustomDescriptors, I take a patch around the feature point, and calculate the histogram of the intensity of the pixels as the descriptor. But it turns out that the ROC curves are even worse than the simplified MOPS descriptor. So I choose to use the simplified SIFT descriptor as my custom descriptor.
・
Reason
for Choosing the Descriptor
It is because it is the best among what I have tried. Also it is position, rotation and illumination invariant.
・
Performances

ROC Curves on graf
|
Method |
AUC |
|
Simple + SSD |
0.673933 |
|
Simple + ratio test |
0.700792 |
|
MOPS + SSD |
0.862090 |
|
MOPS + ratio test |
0.885447 |
|
Custom + SSD |
0.893027 |
|
Custom + ratio test |
0.893922 |
AUC on graf
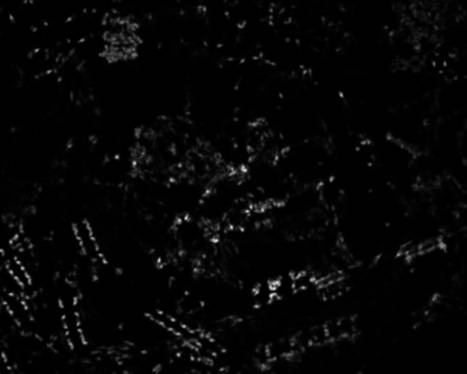
Harris Image for graf
ROC Curves on yosemite
|
Method |
AUC |
|
Simple + SSD |
0.870404 |
|
Simple + ratio test |
0.905507 |
|
MOPS + SSD |
0.904376 |
|
MOPS + ratio test |
0.938999 |
|
Custom + SSD |
0.943664 |
|
Custom + ratio test |
0.954800 |
AUC on yosemite
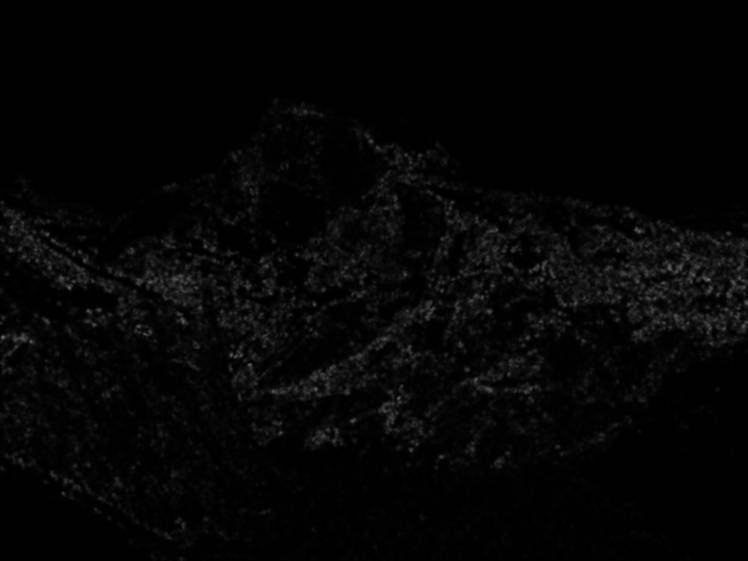
Harris Image for Yosemite
The results on the benchmark datasets are as following.
|
Average AUC |
Simple |
MOPS |
Custom |
|
SSD |
0.513035 |
0.633960 |
0.597734 |
|
ratio test |
0.559956 |
0.601178 |
0.599634 |
Average AUC on Benchmark graf
|
Average AUC |
Simple |
MOPS |
Custom |
|
SSD |
0.307815 |
0.626546 |
0.679888 |
|
ratio test |
0.525774 |
0.654188 |
0.671289 |
Average AUC on Benchmark leuven
|
Average AUC |
Simple |
MOPS |
Custom |
|
SSD |
0.295870 |
0.636941 |
0.649956 |
|
ratio test |
0.480931 |
0.641228 |
0.606301 |
Average AUC on Benchmark bikes
|
Average AUC |
Simple |
MOPS |
Custom |
|
SSD |
0.308886 |
0.659596 |
0.635926 |
|
ratio test |
0.541637 |
0.641010 |
0.624412 |
Average AUC on Benchmark wall
・
Strength
and Weakness
One can see from the ROC curves that my custom descriptor generally outperforms the MOPS descriptor for the simple cases, where the transformation between images is comparatively slight. However, when there is a huge change of view angle (graf), illumination (leuven), blurring (bikes) or a large amount of ambiguous matching, the performances of both MOPS and my custom descriptor drop drastically. For some cases, my descriptor is no longer better that MOPS. This suggests that the descriptors are not so robust against these changes.
・
Some
matching results on the pictures I took
We used our custom descriptor for the following images.
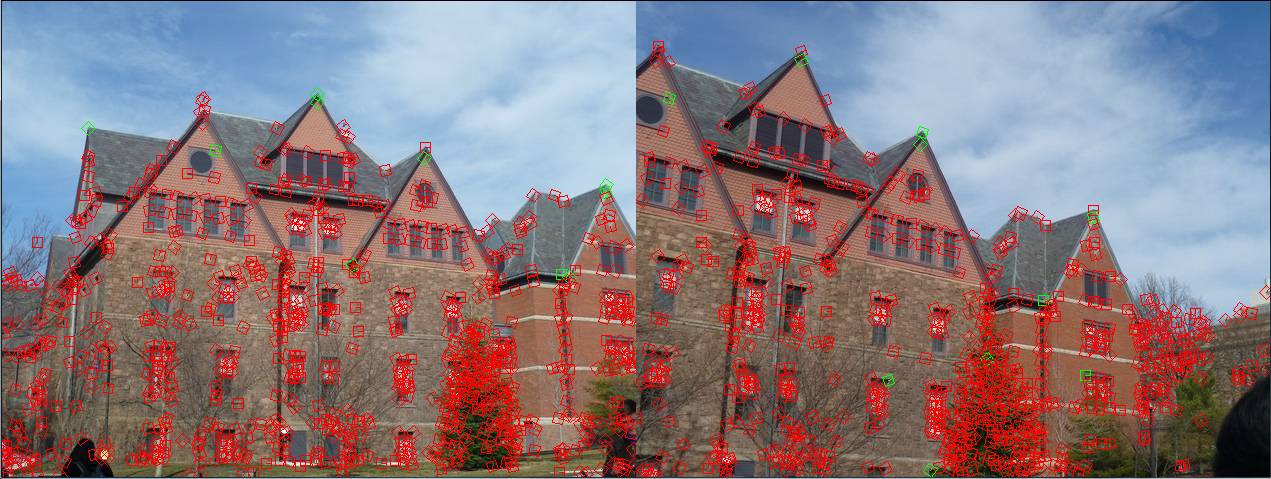
It seems that the feature descriptor works pretty well when the view point doesn’t change very drastically.
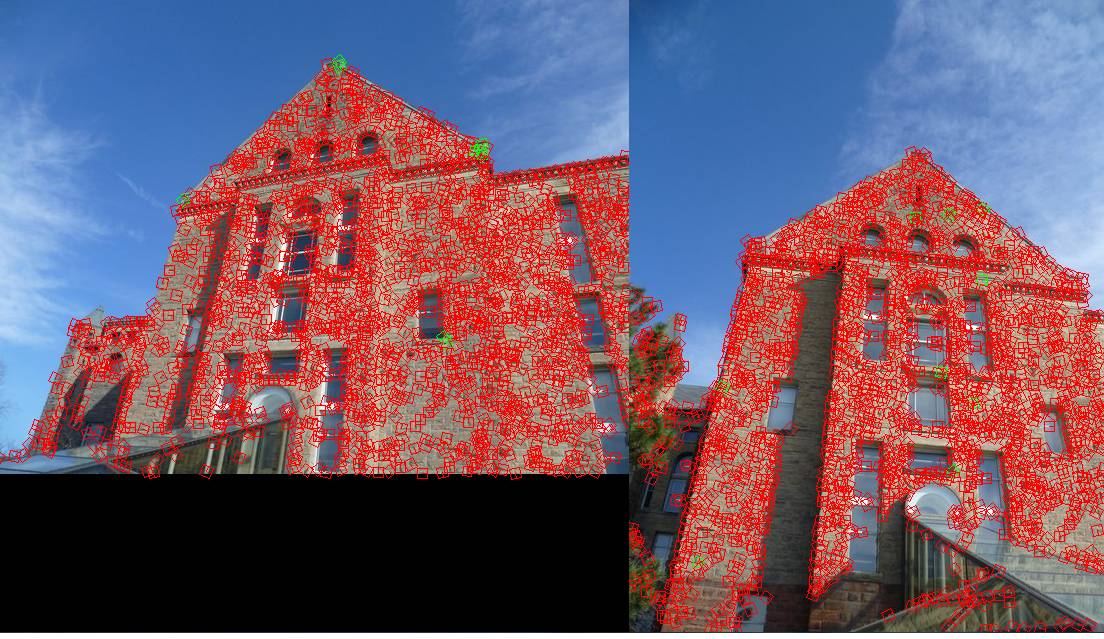
However, if we change the view point from one side of the building to the other side, the descriptor is no longer reliable.
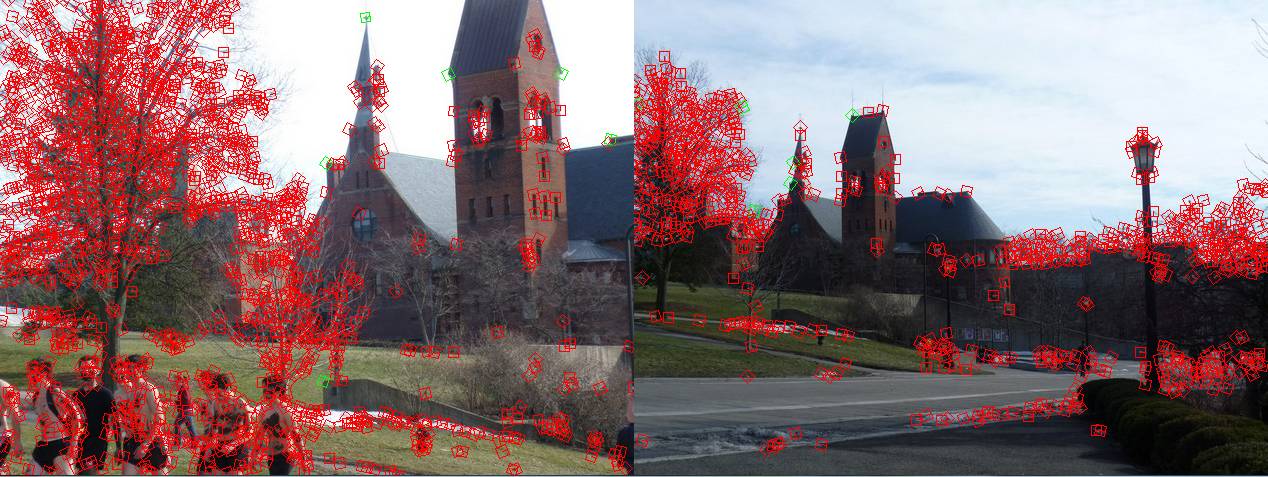
And it is not scale invariant.